
Figure 7.
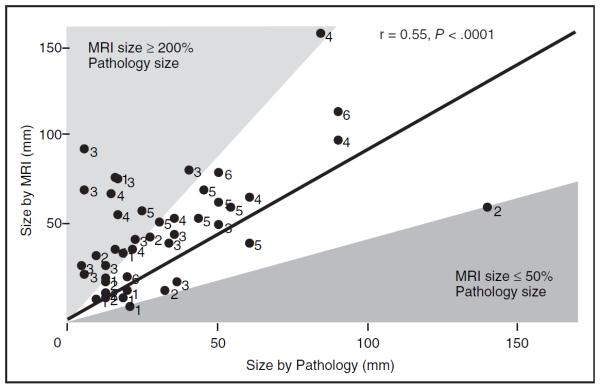
Correlation of magnetic resonance imaging (MRI) size (mm) and pathology size (mm) of ductal carcinoma in situ, labeled by MRI group, shows moderately strong correlation (r = 0.55). Solid line represents 1:1 association. Outliers where MRI size was 200% that of pathology size were predominantly in groups 3 and 4.