
Figure 1.
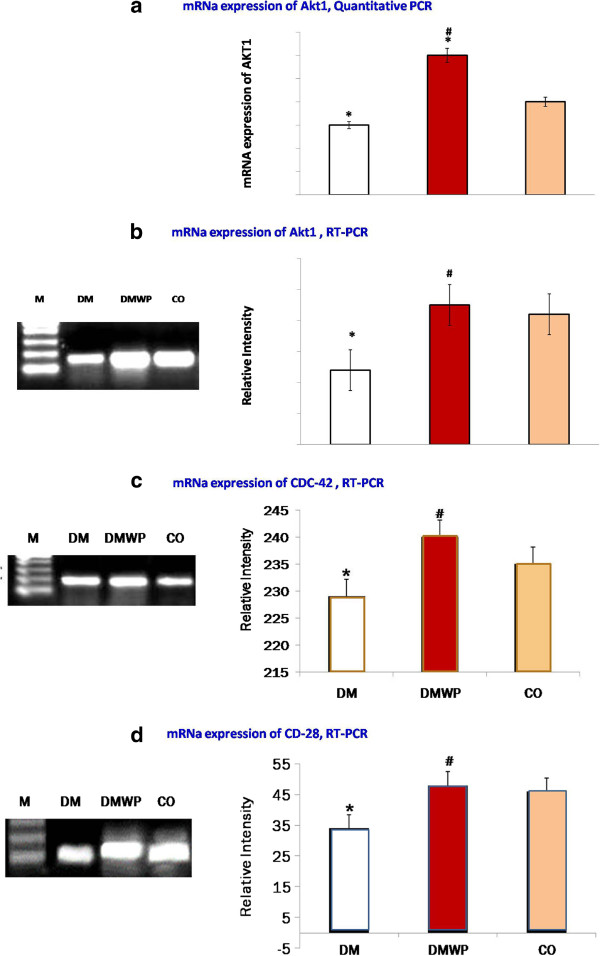
Quantitative analysis of mRNA expression of AKT1 genes (a). Semiquantative PCR-mRNA expression of Akt1 (b), CD28 (c) and Cdc42 (d) of the antigen activated lymphocytes from control, DM and DMWP rats. PCR products were separated and visualized by DNA agarose electrophoresis after amplification of Akt1, CD28 and Cdc42 from splenocyte genomic DNA. Samples from five animals were analyzed. A representative result from each group is presented, while the values in the histograms are the mean ± SD. *shows the significance (p < 0.05) in comparison to the control group. #shows the significance (p < 0.05) in comparison to the diabetic group.