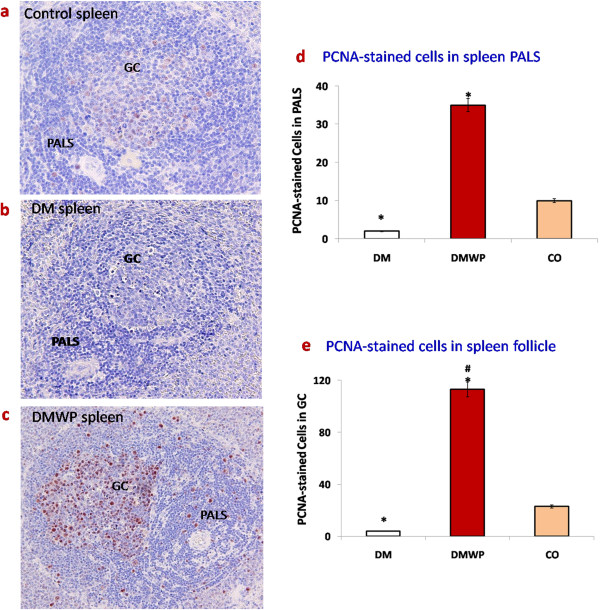
Figure 3.

Spleen sections were stained with PCNA antibodies (×400) to show proliferation activity in control (a), DM (b), DMWP (c) spleens showing the brown proliferating cells in the PALS and germinal centers (GC). Values shown are the mean count of the proliferating cells in both PALS (d) and GC (e) ± SD. *shows the significance (p < 0.05) in comparison to the control group. #shows the significance (p < 0.05) in comparison to the diabetic group.
