Figure 4.

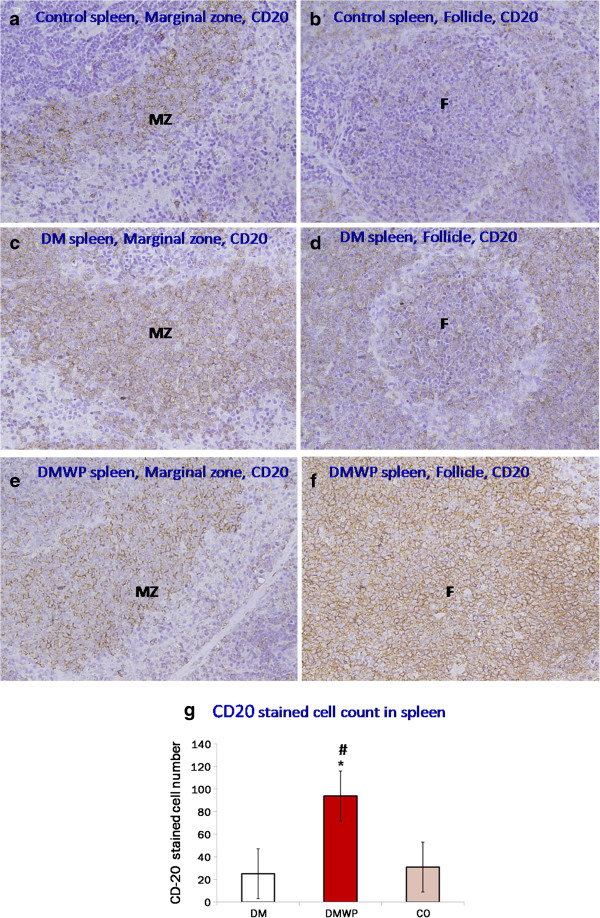
Spleen sections stained with anti-CD20+ antibodies to realize B cells. It shows the marginal zone and lymphatic follicles in the control (a, b), DM (c, d) and DMWP (e, f) groups. The number of B cells was reduced in the marginal zone (MZ) and lymphatic follicles (F) of the diabetic rats and increased in both areas in WP treated diabetic rats (×400). Values shown are the mean count of the CD-20 cells in both MZ and F (g) ± SD. *shows the significance (p < 0.05) in comparison to the control group.
