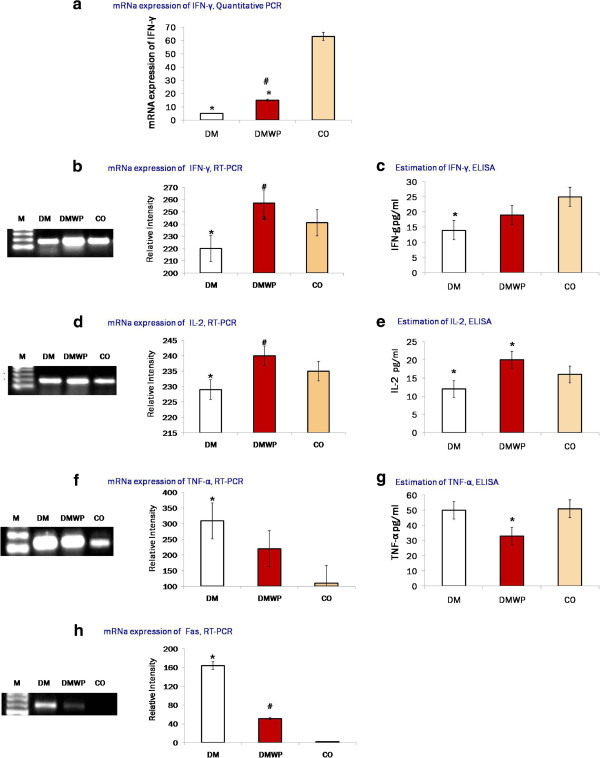
Figure 6.

Quantitative analysis of mRNA expression of AKT1 genes (a). Semiquantative PCR-mRNA expression and the supernatant levels of IFN-γ (b, c) and IL-2 (d, e). It was found that WP restores the polyfunctional T cells (IFN-γ and IL-2 producing cells that exhibit a high proliferation capacity). The mRNA expressions (f) and the supernatant level (g) of TNF-α, and the mRNA expressions of Fas (h). Samples from five animals were analyzed. Samples from five animals were analyzed, while a representative result from each group is presented in this figure. Values shown are mean values ± SD. *shows the significance (p < 0.05) in comparison to the control group. #shows the significance (p < 0.05) in comparison to the diabetic group.
