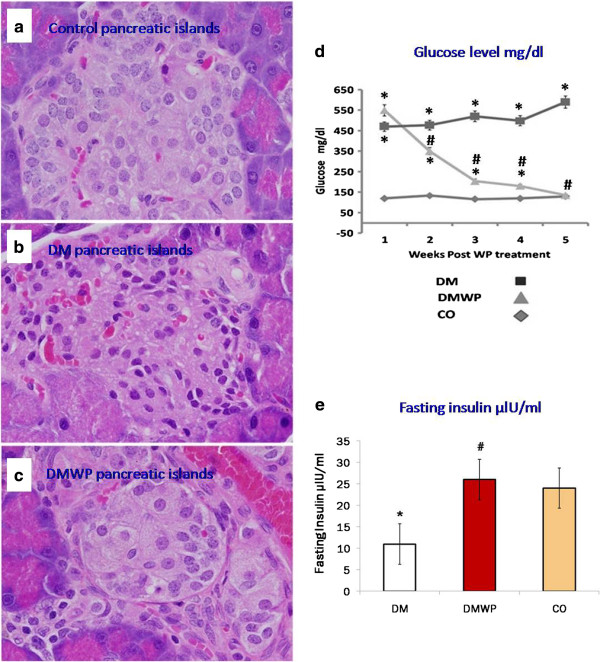
Figure 7.

Representative microscopic sections of the control (a), DM (b) and DMWP (c) rats (E&H × 400). Plasma glucose (d) and insulin (e) concentration of the control, DM and DMWP rats. *shows the significance (p < 0.05) in comparison to the control group. #shows the significance (p < 0.05) in comparison to the diabetic group.
