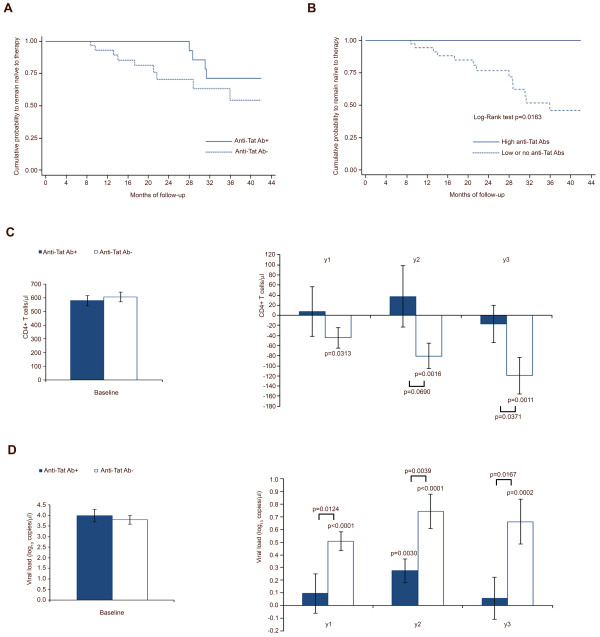
Figure 1.

Kaplan-Meier curves, CD4+ T-cell number and viral load stratified by anti-Tat Abs. (A) Cumulative probability to remain naïve to therapy according to the presence (n = 20) or absence (n = 41) of anti-Tat Abs, and (B) for subjects with high titers of anti-Tat Abs (n = 11) versus subjects with low/no anti-Tat Abs (n = 50). (C) Baseline values and changes from baseline values of CD4+ T-cell counts and (D) viral load levels at years 1, 2 and 3, according to the presence or absence of anti-Tat Abs, respectively, in subjects naïve to therapy (anti-Tat Ab-positive n = 16 year 1, n = 10 year 2, n = 10 year 3; anti-Tat Ab-negative n = 32 year 1, n = 17 year 2, n = 9 year 3). A longitudinal analysis for data arising from repeated measures, adjusted for baseline values, was applied, using the generalized estimating equations method, where the measurements were assumed to be multivariate normal. Data are presented as mean values with standard error.
