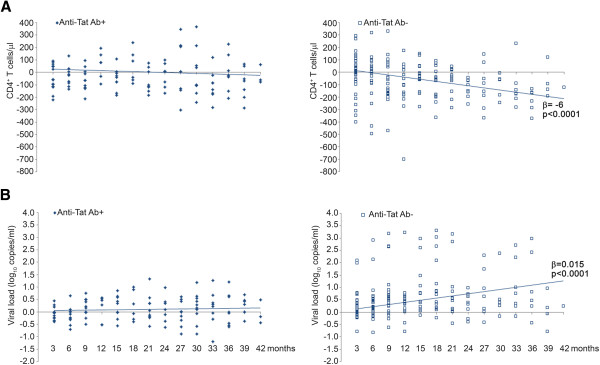
Figure 2.

Changes over time of CD4+ T-cell number and viral load by anti-Tat Abs in individuals naïve to therapy. (A) CD4+ T-cell counts and (B) viral load in subjects who remained naive to therapy were analyzed over time, according to the presence or absence of anti-Tat Abs, by applying a random-effect regression model. The decrease from baseline of CD4+ T cells/μl was -1.1 (95% CI -3.7; 1.5) per month in the anti-Tat Ab-positive subjects and -5.9 (95% CI -8.7; -3.1, p < 0.0001) per month in the anti-Tat Ab-negative individuals, respectively. The difference between the coefficients of regression was statistically significant (p = 0.0060). Similarly, the increase of viral load was 0.003 log10 copies/ml (95% CI -0.004; 0.010) per month in anti-Tat Ab-positive patients and 0.015 (95% CI 0.009; 0.022, p < 0.0001) per month in anti-Tat Ab-negative subjects, respectively. The difference between the slopes was statistically significant (p = 0.0105). All longitudinal samples from 48 individuals were included in the analysis.
