
Figure 6.
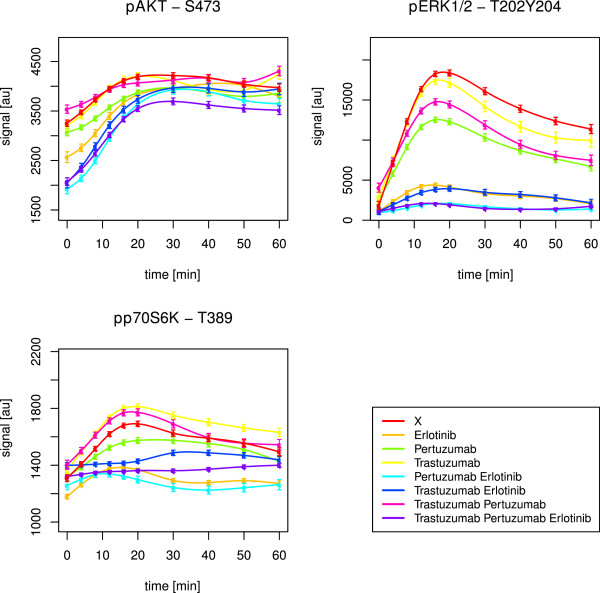
HCC1954 short-term time courses of AKT, ERK1/2 and p70S6K. The figure shows splines and related standard error bars of the measured RPPA data for AKT, ERK1/2 and p70S6K after combined EGF and HRG stimulation in the HCC1954 cell line. The measurements included ten time points up to 60 minutes. The different drug treatments are marked by different colours with ‘X’ denoting no drug treatment.