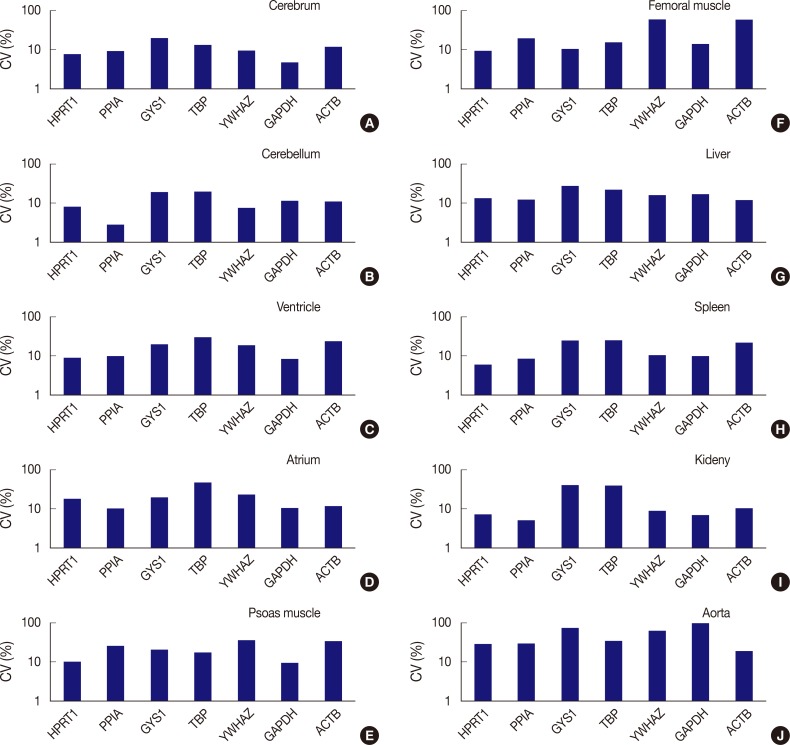
Fig. 3.
Comparison of expression stability between genes in each tissue type. (A) In the cerebrum, GAPDH demonstrates the highest stability, while GYS1 shows the least stable expression. (B) In the cerebellum, PPIA shows the highest stability, while TBP was the least stable. (C) In the ventricle, GAPDH exhibits the highest stability, while TBP was the least stable. (D) In the atrium, all seven genes are found to have coefficient of variation (CV) values over 10%. However, PPIA is relatively stable compared to other genes. (E) In psoas muscle, GAPDH shows the highest stability. (F) In femoral muscle, HPRT1 exhibits the highest stability. YWHAZ and ACTB demonstrate the highest variability in the femoral muscle. (G) In the liver, all genes are found to have CV values over 10%. However, ACTB is relatively stable compared to other genes. (H) In the spleen, HPRT1 demonstrates the highest stability. (I) In the kidney, PPIA shows the highest stability. (J) In aorta, all seven genes demonstrate high CV values over 10%.

