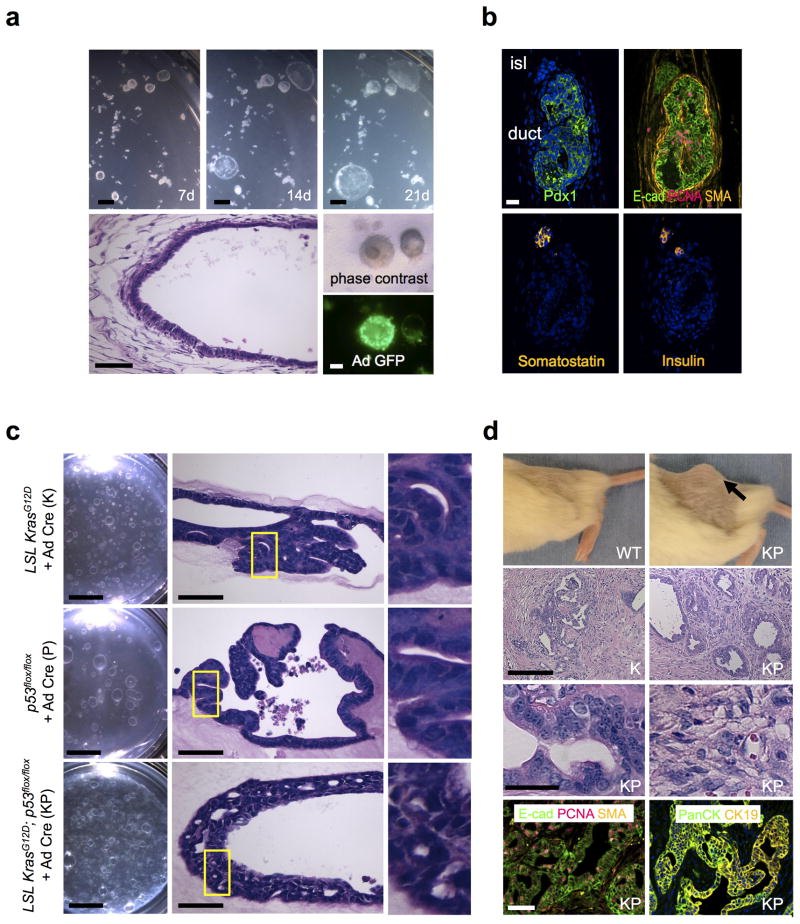
Figure 1. In vitro oncogenic transformation of primary pancreatic organoids and in vivo tumorigenesis.
(a) In vitro culture of wild-type neonatal pancreatic organoids. Top row. Time course stereomicroscopy demonstrating progressive growth of primary pancreatic organoids at days 7, 14 and 21 of air-liquid interface culture. Scale bars, 1 mm. Bottom row. Left, day 7 H&E staining, histologic characterization demonstrates a well-differentiated cystic epithelium with surrounding fibroblastic stroma. Scale bar, 50 μm. Right middle, phase contrast. Right bottom, adeno Cre-GFP infection of pancreatic organoids. Scale bar, 1 mm. (b) Immunofluorescence demonstrates a well-differentiated cystic epithelium with surrounding fibroblastic stroma and a preponderance of epithelial E-cadherin+ and Pdx1+ ductal structures with PCNA+ proliferative cells and SMA+ stromal cells. Bottom row, somatostatin+ and insulin+ endocrine cells in a rare islet structure. Day 7 immunofluorescence is depicted. Scale bar, 25 μm. (c) Transformation of primary pancreatic organoid cultures in vitro. Pancreatic organoids from neonatal mice bearing LSL KrasG12D or/and p53flox/flox alleles (K, P, KP) were cultured with adenovirus Cre-GFP at d0 of primary plating. Left column. Stereomicroscopy of K, P and KP organoids after 20 days of primary culture and an additional 30 days of secondary passage (50 days total). Scale bars, 5 mm. Middle column. H&E staining for the indicated genotypes at day 50. As opposed to wild-type organoids, P organoids exhibited mildly stratified nuclei with moderate nuclear enlargement and K and KP organoids contained enlarged pleomorphic nuclei with stratification and cribriform growth. Scale bars, 50 μm. Right column. Enlargement of the yellow boxed fields. (d) Transformed pancreatic organoids exhibit in vivo tumorigenicity. Top row. In vivo tumor growth of the indicated genotypes, day 30 after s.c. organoid implantation into NOD.Cg-Prkdcscid Il2rgtm1Sug/JicTac mice (NOG) mice. Arrow denotes tumor. 2nd row. H&E staining of tumors. Scale bar, 100 μm. (Left) a representative region of gland-forming invasive adenocarcinoma infiltrating fibrous tissue. (Right) Region from a KP tumor exhibiting poorly differentiated invasive adenocarcinoma with areas of sarcomatoid carcinoma. 3rd row. Enlarged views of glandular (left) and poorly-differentiated regions (right) from a KP tumor. Scale bar, 25 μm. Bottom row. Glandular epithelium from a KP tumor with E-cadherin, PanCK and CK19 immunofluorescence. Immunoreactivity for PCNA-positive proliferative cells and SMA-positive stromal cells is also present. Scale bar, 50 μm.

