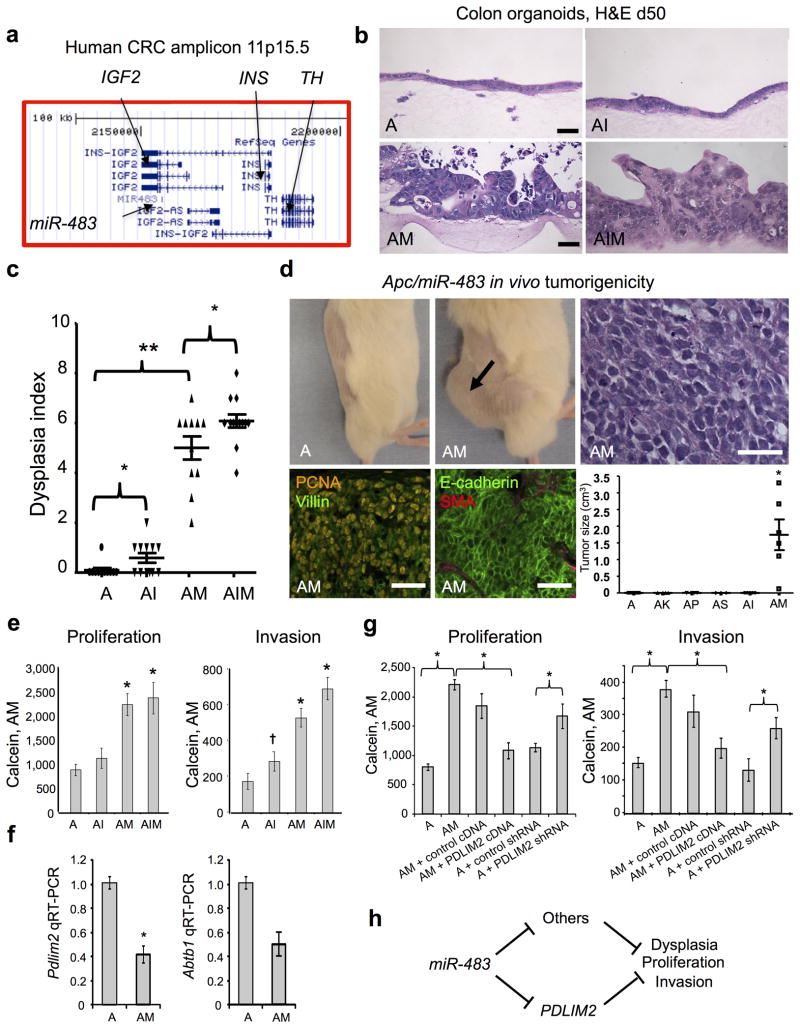
Figure 5. Comparative functional validation of miR-483 and Igf2 transforming activity in primary Apc-null colon organoid culture.
(a) Schematic of human 11p15.5 CRC amplicon indicating the position of miR-483 within IGF2 (UCSC Genome Browser). (b) Functional analysis of miR-483, Igf2 or both in Apc-null colon organoids. Tamoxifen-treated Apcflox/flox; villin-CreER adult colon organoids were infected with appropriate combinations of control LMP retrovirus, Igf2 cDNA-IRES-GFP or lentivirus miR-483/GFP to generate Apc-null (A), Apc-null/Igf2 (AI), Apc-null/miR-483 (AM) or Apc-null/miR-483/Igf2 (AIM) organoids. Significant high-grade epithelial dysplasia with nuclear pleiomorphism was only observed with miR-483-overexpressing organoids (AM and AIM) but not A or AI. H&E, day 50 post-infection. Scale bars, 50 μm. (c) Dysplasia index from blinded pathologic analysis reveals marked transformation of miR-483-containing modules (AM, AIM) versus Apc-null or Apc/Igf2 (AI or AIM vs. A, ** = P < 0.0001) versus Igf2 (AI vs. A; AIM vs. AM, * = P < 0.05). Each individual data point represents n=4–6 microscopic fields containing viable organoids. Day 50 post-infection. Mean +/− SE. (d) AM but not A cells demonstrated robust in vivo tumorigenicity following s.c. transplantation into NSG mice (day 60 post-implantation, 500,000 cells, passage 5). H&E staining demonstrated poorly differentiated adenocarcinoma, scale bar, 50 μm. Tumors exhibited PCNA-positive high mitotic index and expressed epithelial markers villin and E-cadherin but not the stromal marker smooth-muscle actin (SMA), scale bars, 50 μm. (bottom, right), AM versus Apc-null (“A”) or other two gene combinations, Tumor weight examined at day 60 post s.c. organoid implantation, n=10 tumors/genotype. * = P < 0.0001. (e) 96-well invasion and proliferation analyses. FACS-sorted EpCAM+ disaggregated cells from day 14 organoids of the indicated genotypes were replated at 10,000 cells/well into 96-well air-liquid interface culture to form secondary organoids. After 14 days of additional culture, proliferation and invasion in A, AI, AM and AIM organoids was determined by Calcein Red-Orange, AM fluorescence signal. N=12 wells/genotype, mean+/−SE. For proliferation * = P < 0.00003 and for invasion * = P < 1 × 10⁻⁷, † = P <0.03, all vs. the Apc-null “A” module. (f) MiR-483 represses Pdlim2 and Abtb1 RNA in FACS-sorted EpCAM+/GFP+ cells from Apc-null colon organoids 10 days after infection with lentivirus encoding miR-483 or negative control miR. N=3 experiments, mean +/− SE, * = P<0.05. (g) PDLIM2 rescue experiments. AM vs. A organoids were assayed after 14d of culture in 96-well format for invasion and proliferation with either PDLIM2 cDNA overexpression or Pdlim2 shRNA knockdown. * = P < 0.05. N=12, mean +/− SE. (h) Schematic of mediation of miR-483-induced dysplasia by Pdlim2 and other potential targets.

