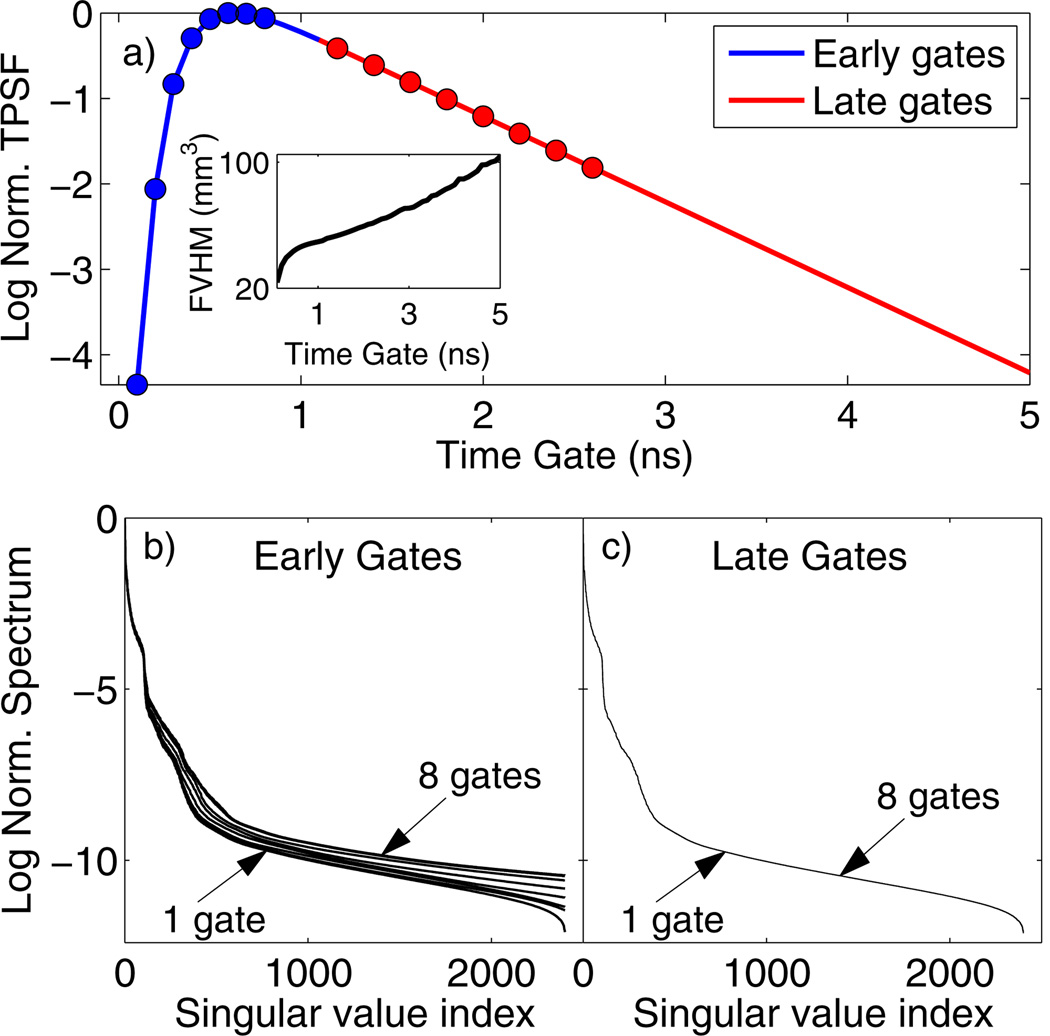
Fig. 1.
(a) Fluorescence TSPF for a 2 cm thick diffusive slab with a fluorescent inclusion (τ = 1 ns) at the center. The inset shows the FVHM of the reconstructed yield for individual time gates. SVD spectra of the DTD weight matrix are shown for (b) one to eight early gates [indicated as blue circles in (a)] and (c) one to eight late gates [red circles in (a)]. The gates were stacked in order of decreasing intensity for both cases.

