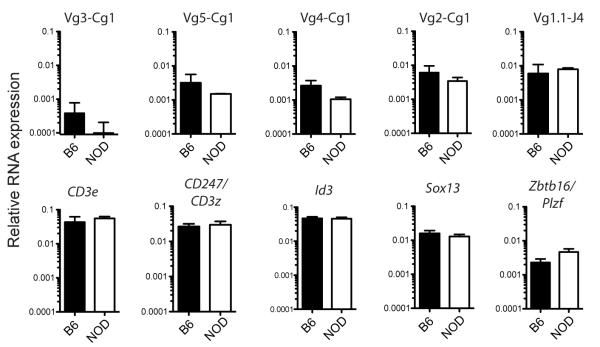
FIGURE 5. Expression of TCR-Vγ rearrangements and other genes in sorted thymic NOD and B6 γδT cells.
QPCR results from TCRγδ+ cells sorted from NOD and B6 thymuses using primers to detect subsets of specific TCR-Vβ rearrangements and other T cell genes. Data are shown as the geometric mean +/− SD, n=2-5. For additional gene expression comparisons, see ref. 33.

