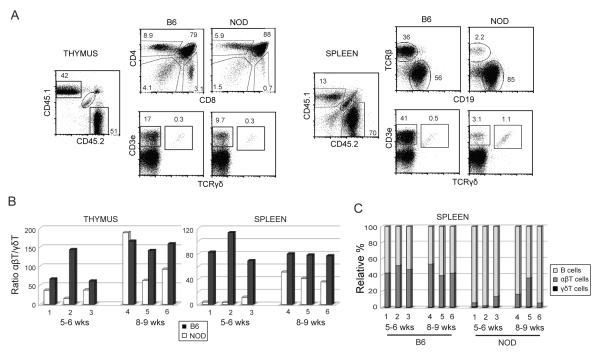
FIGURE 7. NOD cells exhibit differences in establishment of γδT vs. αβT cells in mixed bone marrow chimeras.
Bone marrow cells isolated from NOD and B6 mice and 1 × 10⁶ cells from each strain were mixed and injected into irradiated (NOD × B6)F1.Rag1−/− recipients. Mice were sacrificed after 5-6 or 8-9 weeks and analyzed by flow cytometry for lymphocyte populations in thymus and spleen using CD45.1 (NOD) and CD45.2 (B6) to distinguish donor strains. A. Flow cytometric analysis of a representative chimeric mouse (#1) analyzed at 5 weeks post-injection. Plots on the left show thymocytes were stained for CD4 and CD8 (upper panels) and CD3ε and TCRγδ (lower panels). Splenocytes, shown on the right, were stained for αβTCR and CD19, to distinguish B cells (upper panels), and CD3ε and TCRγδ (lower panels). B, C. Summary of FACs staining results from six mixed bone marrow chimeric mice, three analyzed after 5-6 weeks (#1-3) and three after 8-9 weeks (#4-6). B. Graphs showing the ratio of TCRαβ+/TCRγδ+ cells in thymus (left) and spleen (right) generated from B6 (black bars) and NOD (white bars) donors. C. Graph showing of the relative percentages of B, αβT, and γδT lymphocytes derived from B6 and NOD donors in spleens from the same individual chimeric mice.

