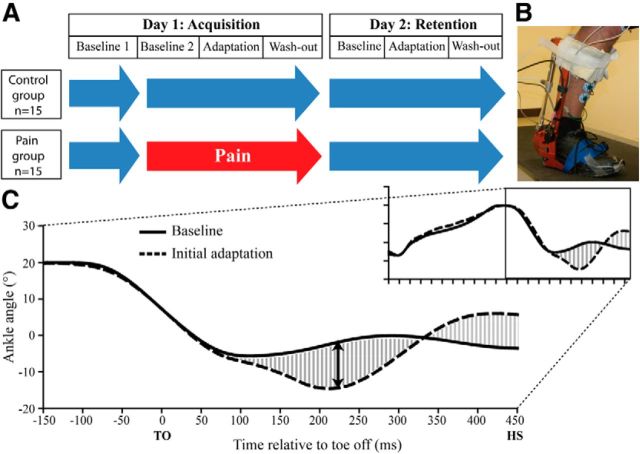
Figure 1.
A, Experimental design. Blue arrows illustrate periods performed without pain while the red arrow illustrates the period performed with pain. B, Picture of the robotized ankle–foot EHO. C, Ankle kinematics during baseline gait (filled line) and the first gait cycle with the perturbation (dashed line) for a representative subject. The mean absolute error (shaded area) and the peak plantarflexion error (black double-arrow) variables are illustrated on the graph. TO, Toe off; HS, heel strike.

