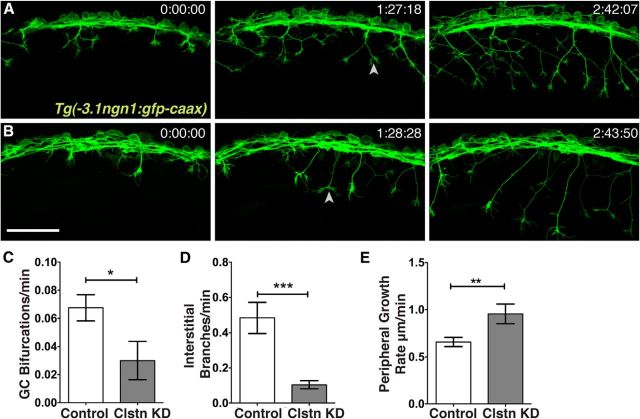
Figure 4.
Live imaging reveals reduced peripheral branching activity in Clstn-1 knockdown. A, B, Time-lapse images (lateral views, anterior left, z-projections) from Tg(−3.1ngn1:gfp-caax) embryos injected with standard control MO (A) or Clstn-1 MO (B). Arrowheads indicate bifurcation events. C–E, Quantification of axon branching and growth rate. *p = 0.03 (unpaired, two-tailed t test). ***p = 0.0008 (unpaired, two-tailed t test). **p = 0.009 (unpaired, two-tailed t test). Scale bar, 100 μm. Time is in hours:minutes:seconds.

