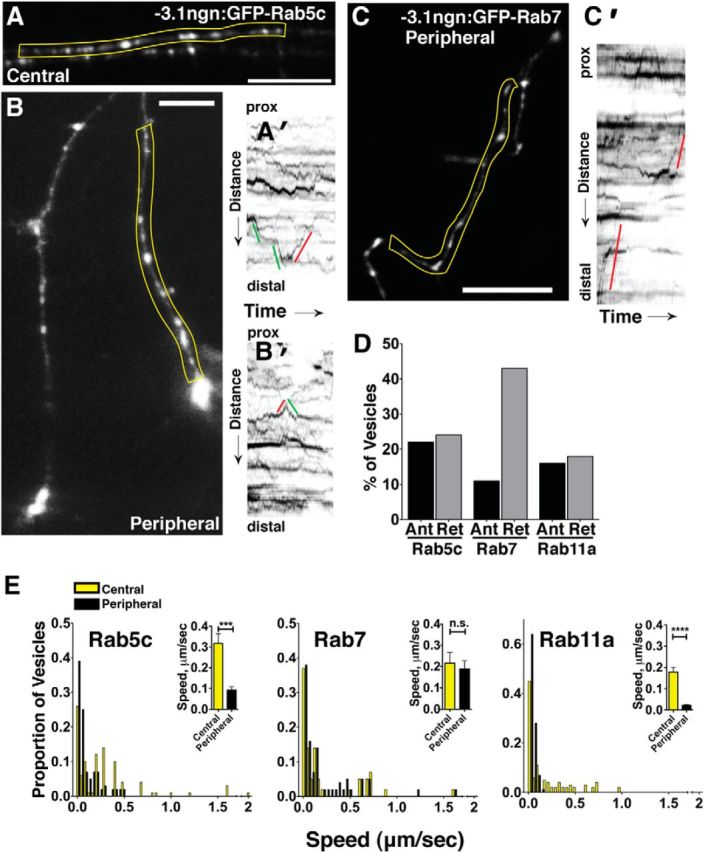
Figure 8.

Characterization of endosome dynamics in RB axons. A, B, GFP-Rab5c-labeled endosomes in central (A) and peripheral (B) axons. A′, Kymograph of yellow region in A with lines indicating anterograde (green) or retrograde (red) movement, with reference to the cell body. prox, Proximal. B′, Kymograph of peripheral Rab5c endosomes in yellow region from B. C, Peripheral RB with GFP-Rab7-labeled late endosomes. C′, Kymograph of yellow region in C showing retrograde (red) movements. D, Directionality of GFP-Rab5c-, GFP-Rab7-, and GFP-Rab11-labeled endosomes in RB cells. Vesicles with no net movement during the imaging period are not shown in the graph. E, Speed distributions of GFP-Rab5c-, GFP-Rab7-, and GFP-Rab11-labeled endosomes in central (yellow) and peripheral (black) axons. Insets, Mean speeds in central and peripheral axons. ***p = 0.001 (unpaired, two-tailed t test). ****p < 0.0001 (unpaired, two-tailed t test). n.s., Not significant. Scale bar, 20 μm.
