
Figure 4.
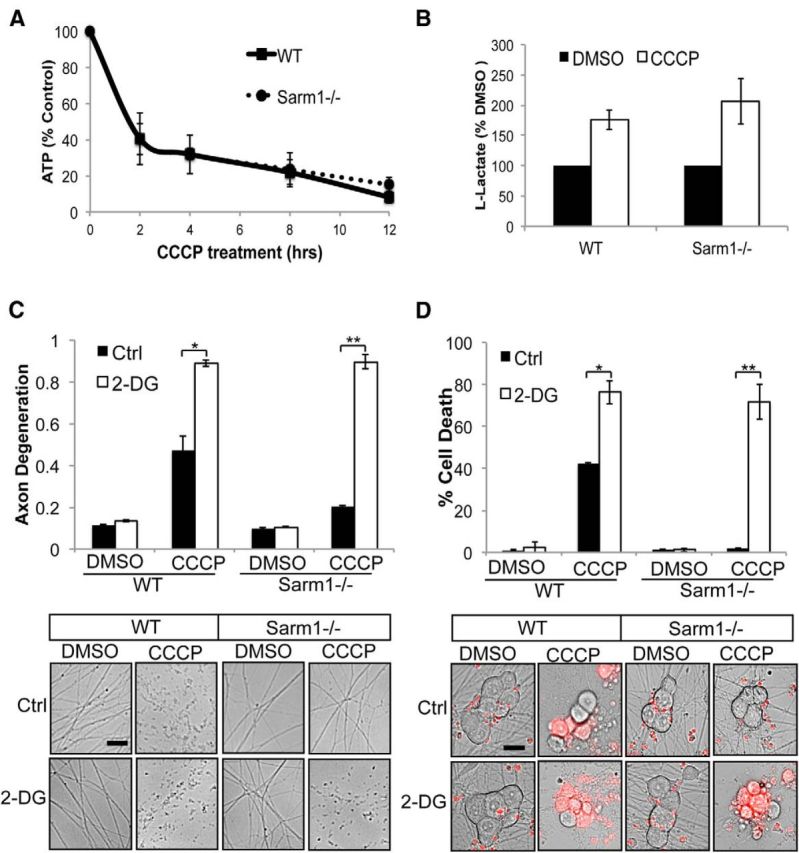
Sarm1−/− neurons use glycolysis to survive prolonged mitochondrial depolarization. A, Measurement of ATP levels as a percentage of control (DMSO) from WT and Sarm1−/− neurons during CCCP treatment. B, l-Lactate levels in media were measured from WT and Sarm1−/− neurons treated with DMSO or 50 μm CCCP (n = 4). Data are represented as a percentage of control. C, Axon degeneration in distal axons from WT and Sarm1−/− treated with DMSO, 50 μm CCCP, 5 mm 2-DG, or 50 μm CCCP + 5 mm 2-DG (n = 3). Below are representative images from neurons treated as described. D, Cell death in WT and Sarm1−/− neurons treated as in C (n = 3). Below are representative images of neuronal soma stained with ethidium homodimer (red). Axon degeneration and cell death were quantified 24 h after treatment. Scale bars, 25 μm. Statistically significant differences are noted in the figure. *p < 0.05; **p < 0.01.