
Figure 7.
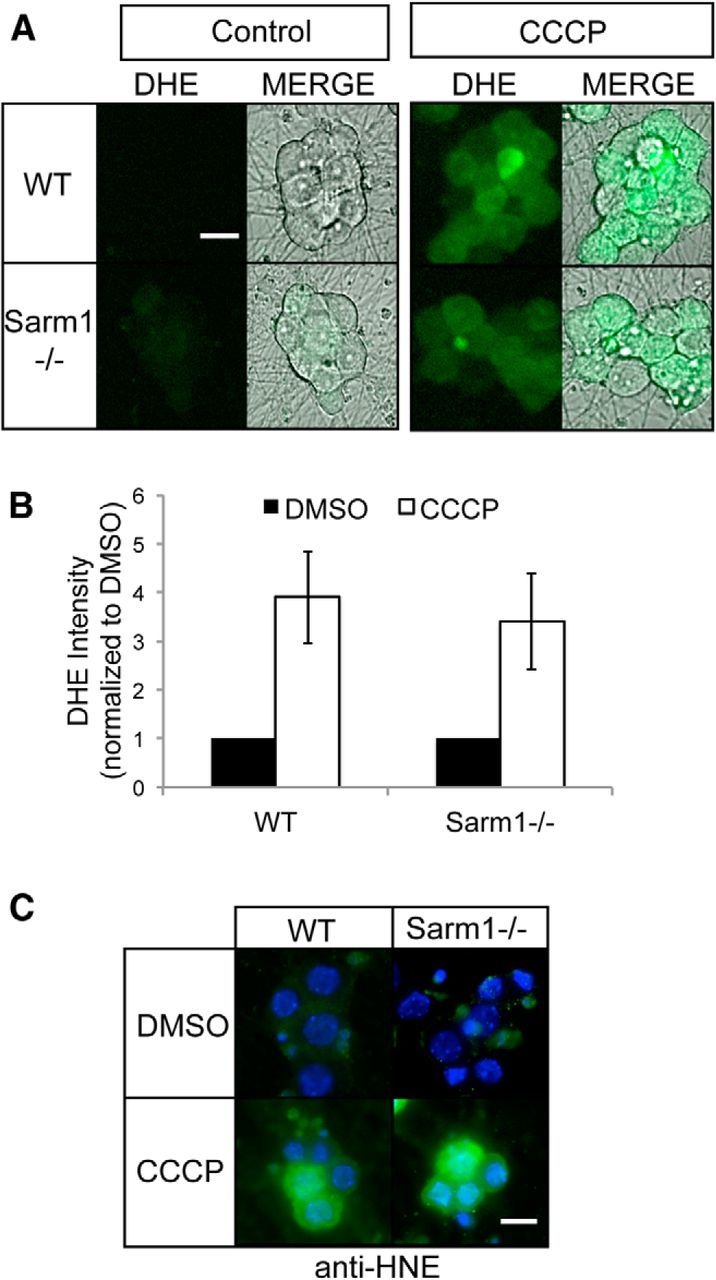
Mitochondrial dysfunction induces ROS generation in WT and Sarm1−/− neurons. A, WT and Sarm1−/− neurons were treated with DMSO or 50 μm CCCP for 8 h. Neurons were loaded with the ROS indicator dye DHE and images of DHE fluorescence were acquired. Bright-field images of soma were also acquired and merged images are shown at right. Scale bar, 25 μm. B, Quantification of DHE fluorescence in neurons treated as in A (n = 3). Statistical analysis indicates no significant difference in DHE intensity after CCCP treatment between WT and Sarm1−/− DRGs. C, Immunofluorescence images of WT and Sarm1−/− neurons treated as in A and stained for HNE, a product of lipid peroxidation. Note the equivalent staining in both WT and Sarm1−/− neurons. Scale bar, 20 μm. Error bars represent SEM.