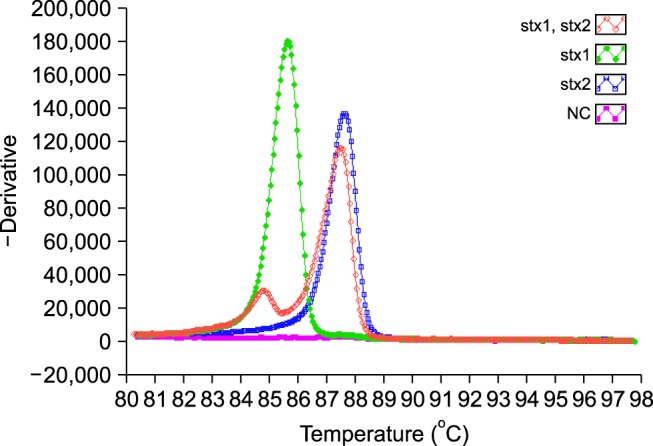
Fig. 1.

Discrimination of the stx1 and stx2 by distinct Tm values generated by annealing curve analysis of the mLAMP assay. The annealing curve shows temperature on the X-axis and fluorescence on the Y-axis. The peaks indicate Tm values generated by annealing curve analysis. Well 1 (red), stx1 and stx2 (STEC 43894); well 2 (green), stx1 (STEC 43890); Well 3 (blue), stx2 (STEC 43889); Well 4 (purple), NC (negative control).
