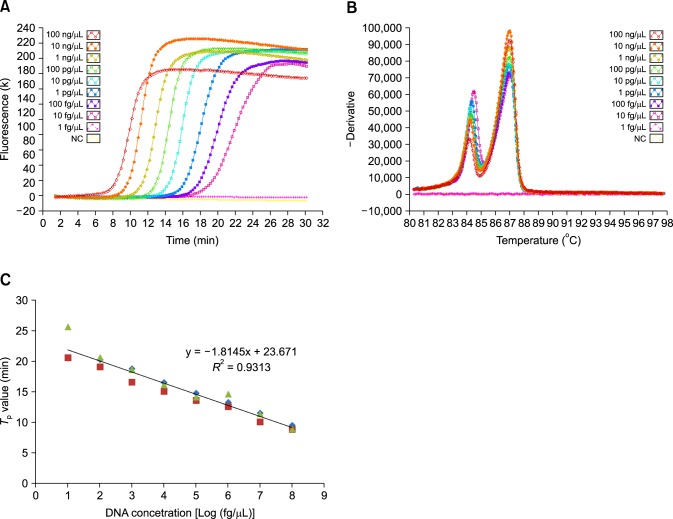
Fig. 2.
Detection limit and standard curve of the mLAMP assay targeting stx1 and stx2 genes of STEC. Ten-fold serial dilutions of STEC (ATCC 43894) template DNA from 100 ng/µL to 1 fg/µL tested in triplicate. (A) The amplification curve shows time in minutes on the X-axis and the amount of fluorescence detected (K) on the Y-axis. The amplification curve generated from 100 ng/µL to 10 fg/µL. (B) Discrimination of shiga toxin genes was based on the annealing curve showing 2 distinct Tm values (84.63 ± 0.30℃ for stx1 and 87.24 ± 0.25℃ for stx2). (C) The standard curve shows the amount of template DNA in log scale on the X-axis and Tp values (min:sec) on the Y-axis. DNA concentrations 1 to 8 correspond to template DNA from 10 fg/µL to 100 ng/µL in log scale.

