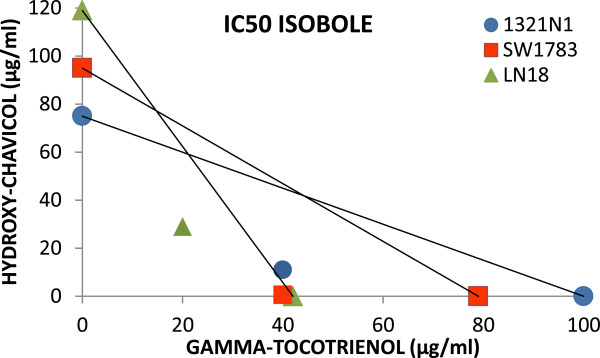
Figure 3.

Isobologram analysis of GTT and HC antiproliferative effects on glioma cells. Individual IC50 doses for GTT and HC were calculated and then plotted on the x and y axes. The line connecting these points represents the drug doses of each compound that would induce the same growth inhibition when used in combination if the interaction between these compounds were additive. The data point on the isobologram represents the actual doses of combined GTT and HC treatment that results in 50% growth inhibition. Since the data point is positioned well below the line, a synergistic anti-proliferative effect is indicated.
