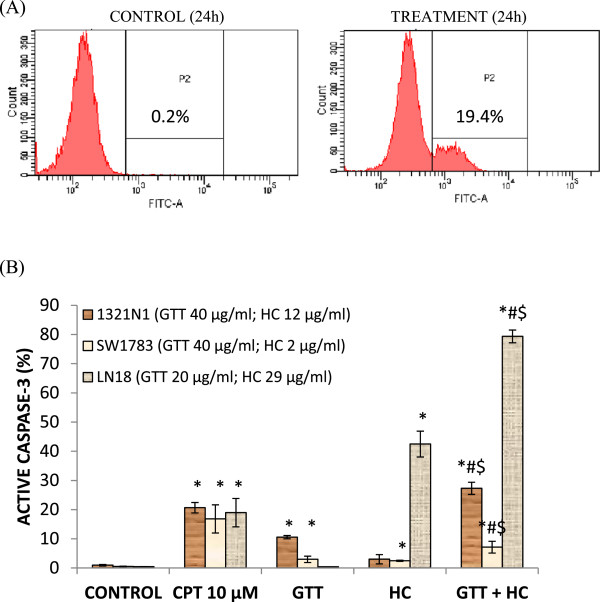
Figure 4.

Detection of apoptosis using flow cytometry after caspase-3 antibody staining. 1321N1, SW1783 and LN18 cells were treated with combined treatments at IC50 concentrations for 24 h. (A) An example of active caspase-3 detection diagram from 1321N1 cells: viable cells are in the left quadrant, while the presence of active caspase-3 is shown in right quadrant (P2). (B) Combined compounds caused greater inhibition of growth of 1321N1, SW1783 and LN18 cells than either agent alone as evidence by the presence of active caspase-3. Each value represents mean ± SD of three independent experiments. *P < 0.05 compare to control. # P < 0.05 compare to GTT. $P < 0.05 compare to HC.
