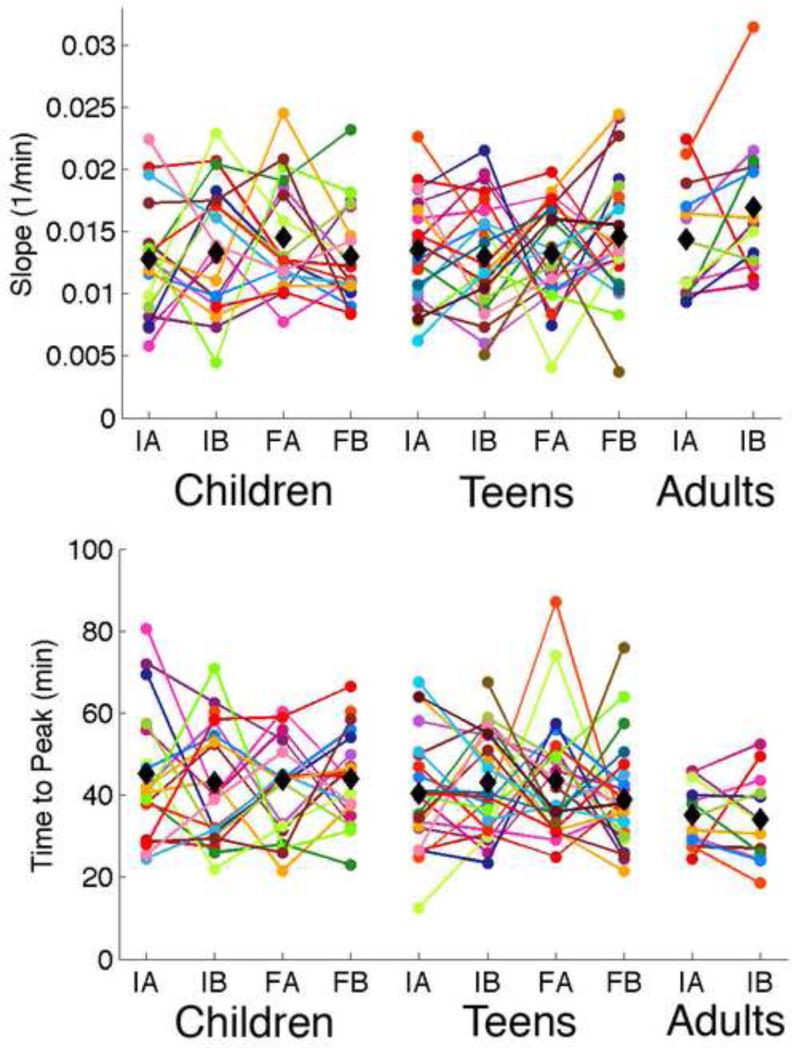
Figure 4.
Parameters obtained from the rise of SWA in the first NREM sleep episode. Each individual is shown in one color. The top plot shows the slope of the rise to the peak in the first NREM sleep episode. The bottom plots shows the time in minutes to the first peak. IA = Initial adaptation; IB = Initial baseline; FA = Final Adaptation; FB = Final Baseline. Mean values at each time point are shown in black diamonds.

