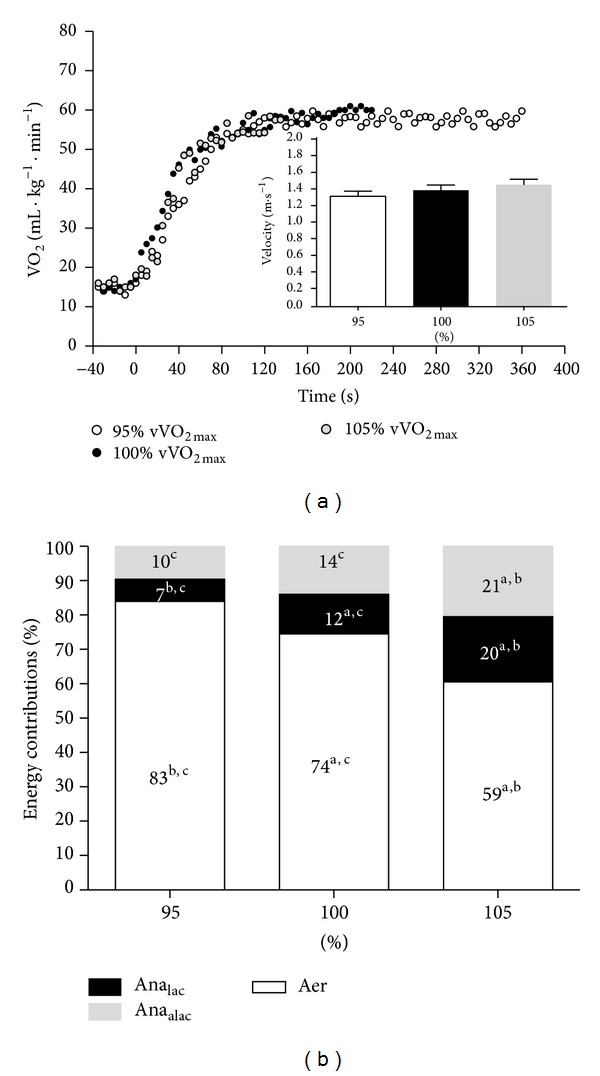
Figure 1.

(a) VO2 kinetics individual response 5 s time average at 95, 100, and 105% of vVO2max. The insets represent the mean velocity values of each time to exhaustion bout; (b) mean aerobic, anaerobic lactic, and anaerobic alactic perceptual contributions obtained during the square wave exercises at 95, 100, and 105% of vVO2max (differences between intensities are identified by a, b, and c for 95, 100, and 105% of vVO2max, resp.; P ≤ 0.05).
