Figure 2.

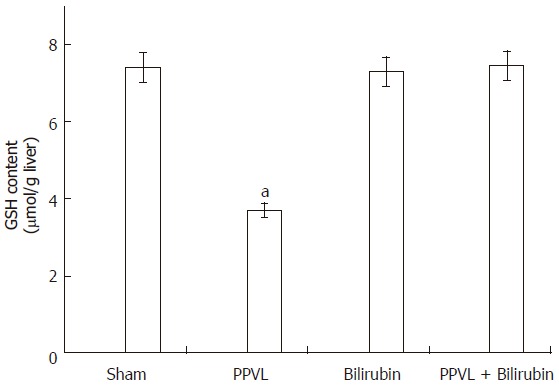
Effect of PPVL and bilirubin on GSH liver content. Rats were treated as described in Methods. Values are the means of three different experiments using three rats each time, and bars indicate SE. aP < 0.05 vs sham.

Effect of PPVL and bilirubin on GSH liver content. Rats were treated as described in Methods. Values are the means of three different experiments using three rats each time, and bars indicate SE. aP < 0.05 vs sham.