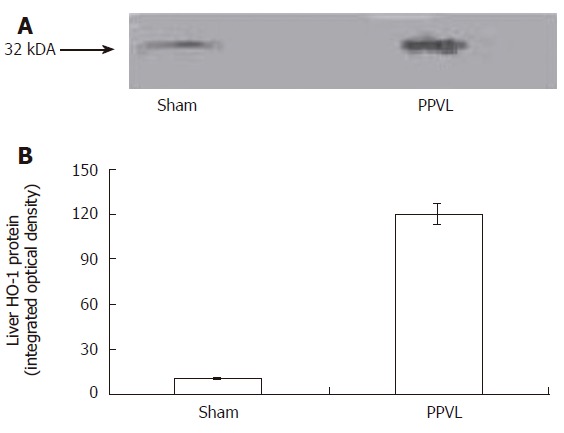
Figure 4.

Western blot analysis of HO-1 expression in PPVL rat liver (A). Densitometry was done to quantify HO-1 protein expression (B). The blot is representative of 3 blots with a total of 4-5 samples/group between the 3 blots. P < 0.01 sham vs PPVL group.
