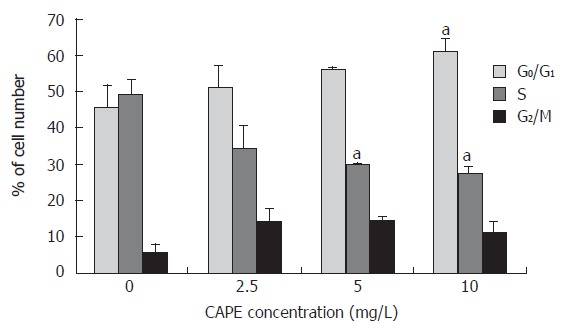
Figure 2.

Effect of CAPE on SW480 cell cycle distribution. The percentage of cells in each phase of the cell cycle, G0/G1, S, and G2/M was determined by FCM after cells were treated with indicated concentrations (2.5, 5 and 10 mg/L) of CAPE for 24 h. aP < 0.05 vs the control group, treated with vehicle, DMSO only.
