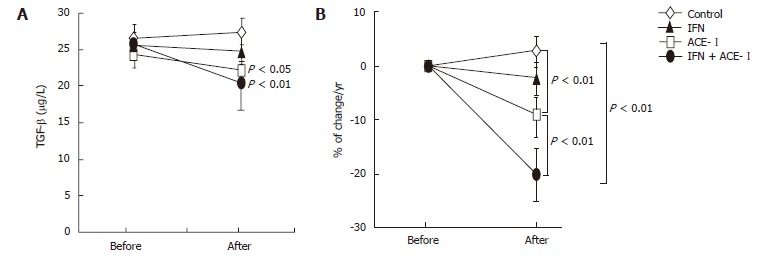
Figure 5.

The effects of IFN and ACE-I on the serum TGF-β in the patients with refractory chronic hepatitis C. A: TGF-β level before and after the study; B: % of change in the TGF-β level in each group. Control: untreated control group. ACE-I, IFN: ACE-I- and IFN-treated groups, respectively. IFN + ACE-I: combination treated group with ACE-I and IFN. The data represent the means ± SD.
