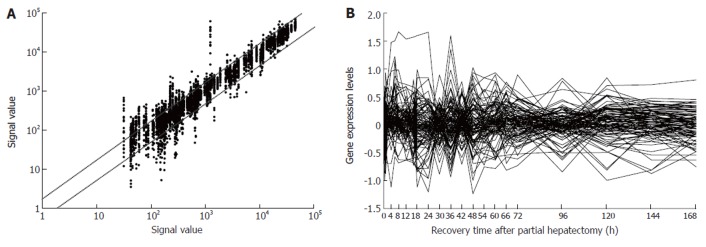
Figure 1.

Expression frequency, abundance and changes of 107 blood coagulation response-associated genes during rat liver regeneration. Detection data of Rat Genome 230 2.0 array were analyzed and graphed with Microsoft Excel. A: Gene expression frequency. The dots above bias represent the genes up-regulated more than two fold, and total times of up-regulation were 342; those below bias down-regulated more than two fold, and times of down-regulation were 253; and the ones between biases no-sense alteration; B: Gene expression abundance and changes. Seventy-six genes were 2-46 fold up-regulated, and 62 genes 2-10 fold down- regulated.
