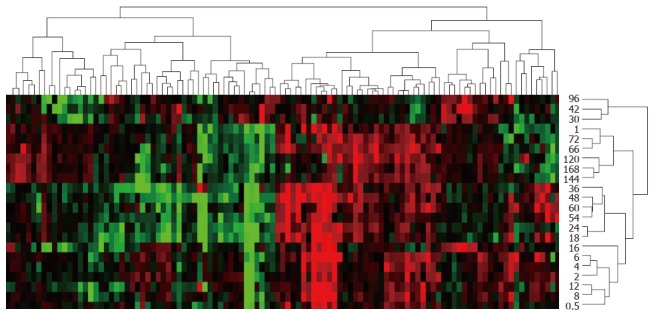
Figure 3.

Expression similarity and time relevance clusters of 107 blood coagulation response-associated genes during liver regeneration. Detection data of Rat Genome 230 2.0 array were analyzed by H-clustering. Red represents up-regulated genes chiefly associated with promoting blood coagulation; Green represents down-regulated ones mainly associated with inhibiting blood coagulation; Black: No-sense in expression change. The upper and right trees respectively show expression similarity and time series clusters, by which the above genes were classified into 5 and 15 groups separately.
