
Figure 3.
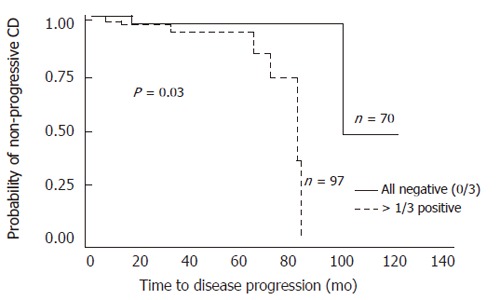
Kaplan Meier survival analysis. Comparison of time to progression from non-complicating to complicating disease behaviors between patients positive for 1 immune response to ASCA, I2 and OmpC (n = 97) (—) and those negative for all 3 (n = 70) (----).