
Figure 1.
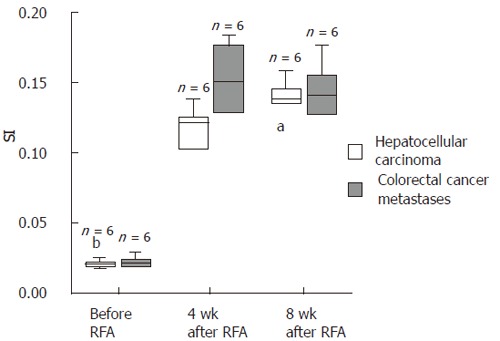
Stimulation indices of CD8+ T cells. The Box-Whisker-plots show the ratio of IFNγ secretion of stimulated vs unstimulated CD8+ T cells as determined by a cytokine secretion and capture assay before, 4 and 8 wk after RFA. White boxes represent the patients with HCC and grey boxes the patients with colorectal cancer metastases. Outlayers are marked with "a", extremes with "b". For significances refer to table 1.