
Figure 2.
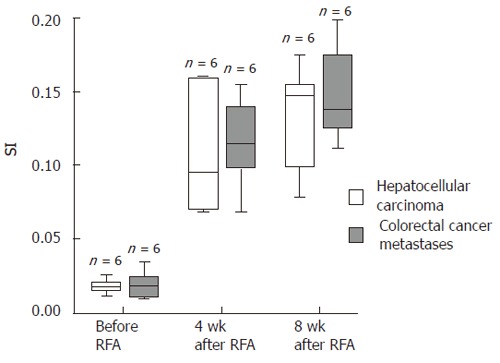
Stimulation indices of CD4+ T cells. The Box-Whisker-plots show the ratio of IFNγ secretion of stimulated vs unstimulated CD4+ T cells as determined by a cytokine secretion and capture assay before, 4 and 8 wk after RFA. White boxes represent the patients with HCC and grey boxes the patients with colorectal cancer metastases. Outlayers are marked with o, extremes with *. For significances refer to table 1.