
Figure 2.
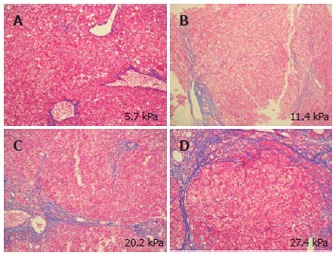
Azan-Mallory-stained liver tissue and liver stiffness measurement. A and B: stage 1 liver tissue samples, showing that the grade of fibrosis and elasticity was higher for B than for A; C: stage 3 liver tissue sample; D: stage 4 liver tissue sample. The elasticity thus increased as the fibrosis progressed.