
Figure 5.
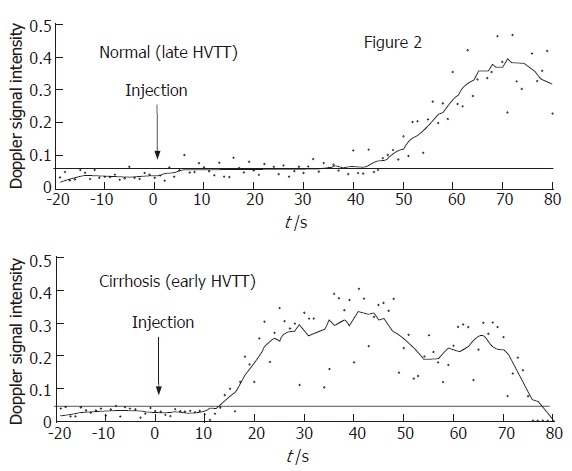
Hepatic vascular transit times (HVTT) following a bolus injection of a microbubble contrast agent, measured in a volunteer without significant liver disease (upper graph) and a patient with cirrhosis (lower graph). There is a much shorter HVTT in the patient with cirrhosis. Adapted from Lim et al[23].