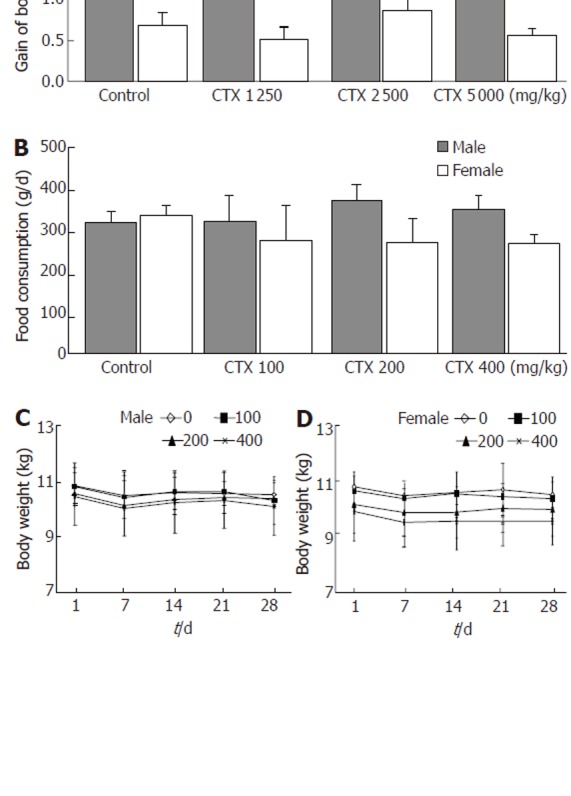
Figure 2.

Body weight and food consumption. A: Final gains in body weight for each group administered with indicated Chunggan extract (CGX) after 2 wk of the acute toxicity experiment (n = 2 males and 2 females); B: Average daily food consumption for each group (n = 3 males and 3 females) during the subacute toxicity experiment; C: Change in body weight during 4 wk of the subacute toxicological experiment, shown separately for males (n = 3) and females (n = 3). Values represent the mean ± SD.
