
Figure 2.
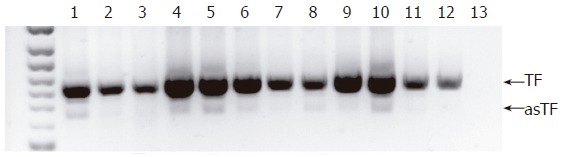
Assessment of TF and asTF expression by RT-PCR. 1: DLD-1; 2: SW48; 3: PANC-1; 4: BxPC-3; 5: PaCa-44; 6: Capan-2; 7: Capan-1; 8: AsPC-1; 9: NP9; 10: NP29; 11: HeLa; 12: Fibroblasts; 13: Negative control.
Official websites use .gov
A
.gov website belongs to an official
government organization in the United States.
Secure .gov websites use HTTPS
A lock (
) or https:// means you've safely
connected to the .gov website. Share sensitive
information only on official, secure websites.
Assessment of TF and asTF expression by RT-PCR. 1: DLD-1; 2: SW48; 3: PANC-1; 4: BxPC-3; 5: PaCa-44; 6: Capan-2; 7: Capan-1; 8: AsPC-1; 9: NP9; 10: NP29; 11: HeLa; 12: Fibroblasts; 13: Negative control.