Figure 2.

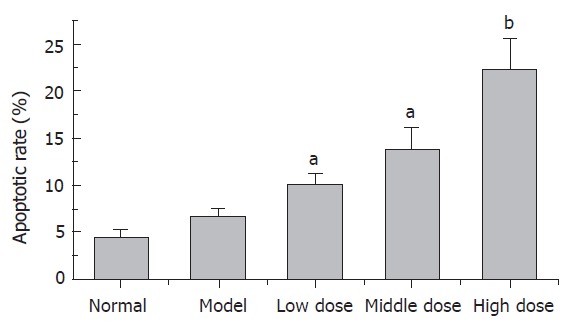
QGHXF induced apoptotic rate of HSC (n = 6, mean ± SD). There were significant differences between model group and QGHXF groups. aP < 0.05 vs model group. bP < 0.01 vs model group.

QGHXF induced apoptotic rate of HSC (n = 6, mean ± SD). There were significant differences between model group and QGHXF groups. aP < 0.05 vs model group. bP < 0.01 vs model group.