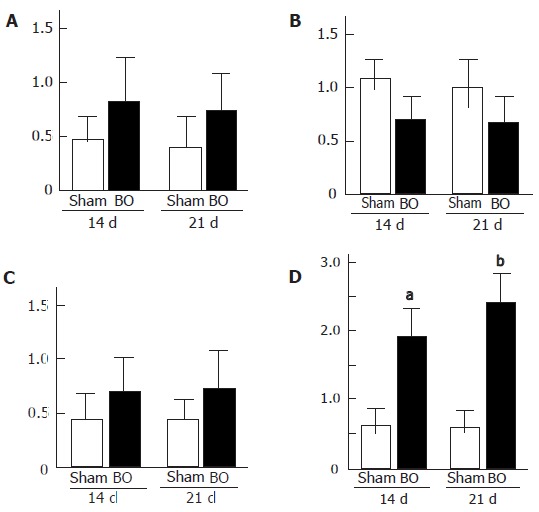
Figure 1.

A: Hepatocyte growth factor (HGF); B: c-Met; C: vascular endothelial growth factor (VEGF); D: transforming growth factor-β1 (TGF-β1) mRNA expression in rat liver at 14 and 21 d after biliary obstruction (BO) and sham-operation (sham). (aP < 0.05 vs sham-operated control, bP < 0.03 vs sham-operated control). Results are expressed as mean ± SD of n = 10 for each period in each group.
