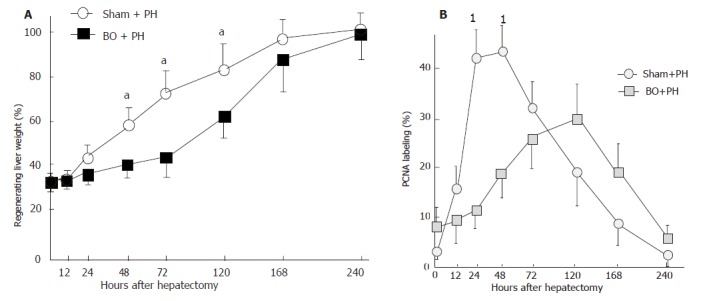
Figure 4.

A: Changes in regenerating liver weight ratio after 70% partial patectomy (PH) in the sham-operated (sham) rats and the biliary obstructed (BO) rats (aP <0.05 between the BO + PH group and the sham + PH group). Results are expressed as mean ± SD of n = 10 for each period in each group. B: Changes in the hepatocyte PCNA labeling index after 70% hepatectomy (PH) in the sham-operated (sham) rats and the biliary obstructed (BO) rats (1P < 0.03 between the BO + PH group and the sham + PH group). Results are expressed as mean ± SD of n = 10 for each period in each group.
