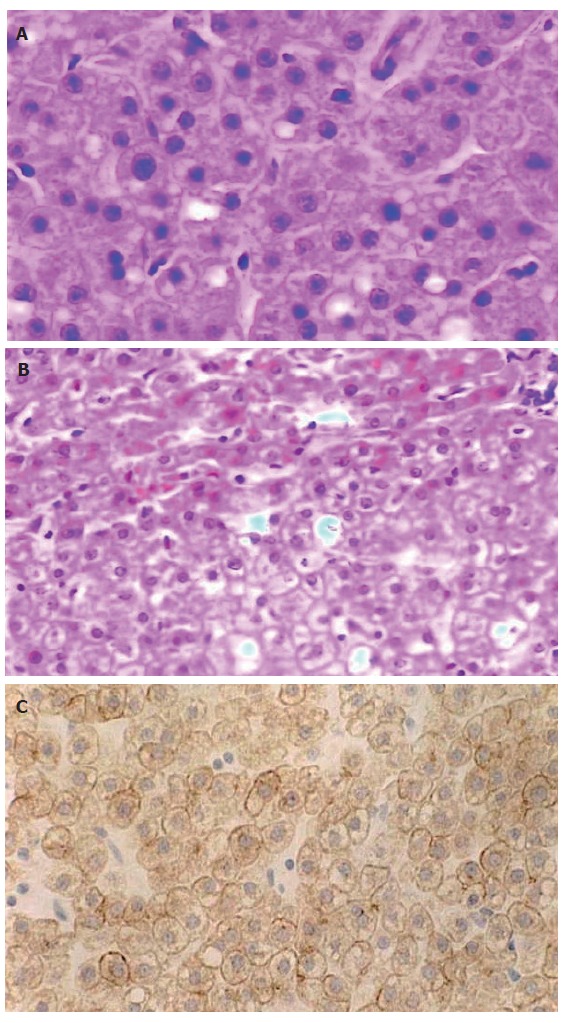
Figure 2.

Liver cell adenoma (× 400). A: Similar to normal hepatocytes, arranged in two-cell-thick cords separated by hepatic sinusoids (HE); B: Showing the border between LCA (lower) and surrounding liver parenchyma (upper) (HE); C: CK18 immunoreactivity (S-P).
