Figure 4.

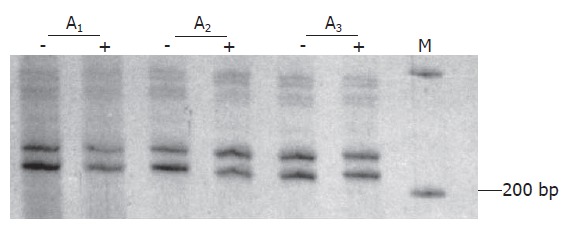
Data of clonality test of three areas of liver parenchymal tissues (A1-A3). Neither of the bands on gel shows marked intensity change for the samples pretreated with Hha I (+) compared to those not treated (-).

Data of clonality test of three areas of liver parenchymal tissues (A1-A3). Neither of the bands on gel shows marked intensity change for the samples pretreated with Hha I (+) compared to those not treated (-).