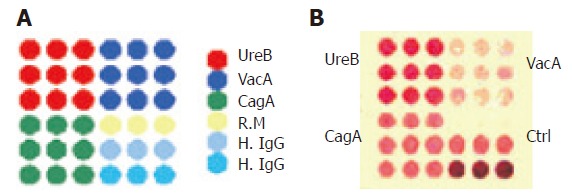
Figure 1.

A: Schematic map of protein distribution on the protein array. Four squares were involved and different proteins were printed in different areas: UreB in upper left area; VacA in upper right area; CagA in left bottom area; R.M (10 ng) in the upper row of right bottom area for negative control (Ctrl), H. IgG in the middle row for positive control and at the bottom row for strong positive control; B: positive results of anti-UreB IgG, anti-CagA IgG and anti-VacA IgG detected by the protein array.
