
Figure 3.
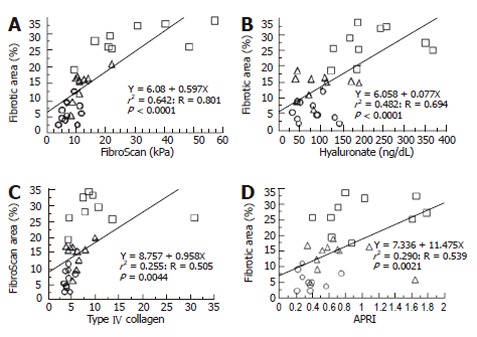
A linear regression analysis of the fibrotic area and liver fibrotic markers including FibroScan. A positive correlation was seen for all the markers such as FibroScan (A), hyaluronate (B), type IV collagen (C), and aspartate transaminase levels in comparison to the platelet ratio index (APRI) (D). ○: NBNC and normal liver; △: HBV and chronic hepatitis; □: HCV and liver cirrhosis.