
Figure 3.
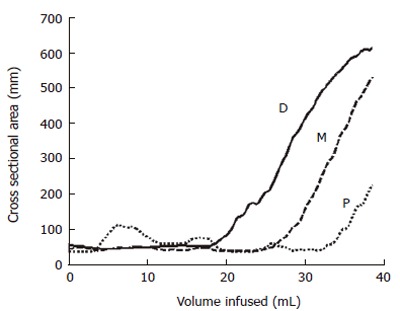
Plot showing the changes in the CSAs at the proximal (P), middle (M) and distal (D) electrode pairs as the balloon is distended at a constant flow rate indicated by the increase in volume.
Official websites use .gov
A
.gov website belongs to an official
government organization in the United States.
Secure .gov websites use HTTPS
A lock (
) or https:// means you've safely
connected to the .gov website. Share sensitive
information only on official, secure websites.
Plot showing the changes in the CSAs at the proximal (P), middle (M) and distal (D) electrode pairs as the balloon is distended at a constant flow rate indicated by the increase in volume.