
Figure 3.
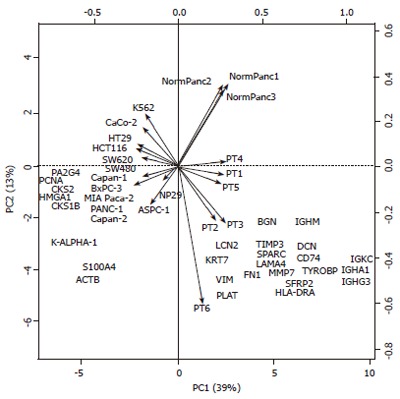
Principal component analysis (PCA) of gene expression data. Biplot resulting from a PCA of the line and column centered data containing 871 genes (individuals) in lines and 22 samples in columns (variables). The 28 genes contributing the most to the total variability are shown. The two principal components (PC1 and PC2) contribute to more than 50% (39% and 13%) of the total variability and resolve four biological sample categories: PC1 on the horizontal x-axis distinguish between cell lines (left) and tissue samples (right) whereas PC2 on the vertical y-axis distinguish between malignant pancreas samples (bottom) and other sample categories (top).