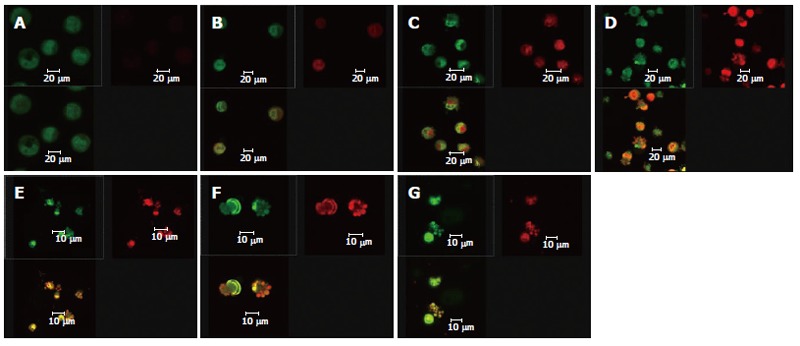
Figure 2.

Effect of solanine on the morphology of HepG2. A: Control group, PMT1 nuclear chromatin was stained green and showed normal structure, while PMT2 showed no or only weak red fluorescence; B: Group treated with Solanine with final concentration of 0.0032 μg/mL: The cells show slightly pyknotic and crumb-shaped structures. Permeability of cell membrane has increased, so that AO and EB can enter the cells, resulting in the cells showing both green and red fluorescence; C: Group treated with Solanine with final concentration of 0.016 μg/mL: The cells show slightly pyknotic and crumb-shaped structure. Fragments or apoptotic bodies appear in the nuclei of some of the cells; D: Group treated with solanine with final concentration of 0.08 μg/mL: Cell structure is further damaged. The cells are not only stained with AO and EB, but morphologically the nuclei have become deeply stained fragments or apoptotic bodies; E: Group treated with solanine with final concentration of 0.4 μg/mL: Cell structure is damaged even further. Apoptotic bodies have definitely appeared; F: Group treated with solanine with final concentration of 2 μg/mL: Definite apoptotic bodies can be seen, while the number of cells in sight has decreased; G: Group treated with camptothecin with final concentration of 2 μg/mL: The appearance of apoptotic bodies is obvious in HepG2 cells.
