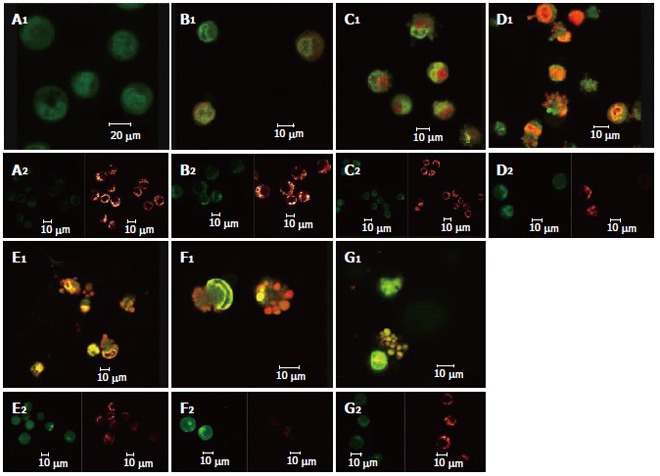
Figure 5.

Changes induced by solanine in cell morphology, [Ca2+]i in cells, and membrane potential of mitochondria in HepG2 cells in the process of apoptosis. A: Control; B: 0.0032 μg/mL solanine; C: 0.016 μg/mL solanine; D: 0.08 μg/mL solanine; E: 0.4 μg/mL solanine; F: 2 μg/mL solanine; G: 0.08 μg/mL camptothecin.
